Keeping this here, and Updating it as the index gets updated.
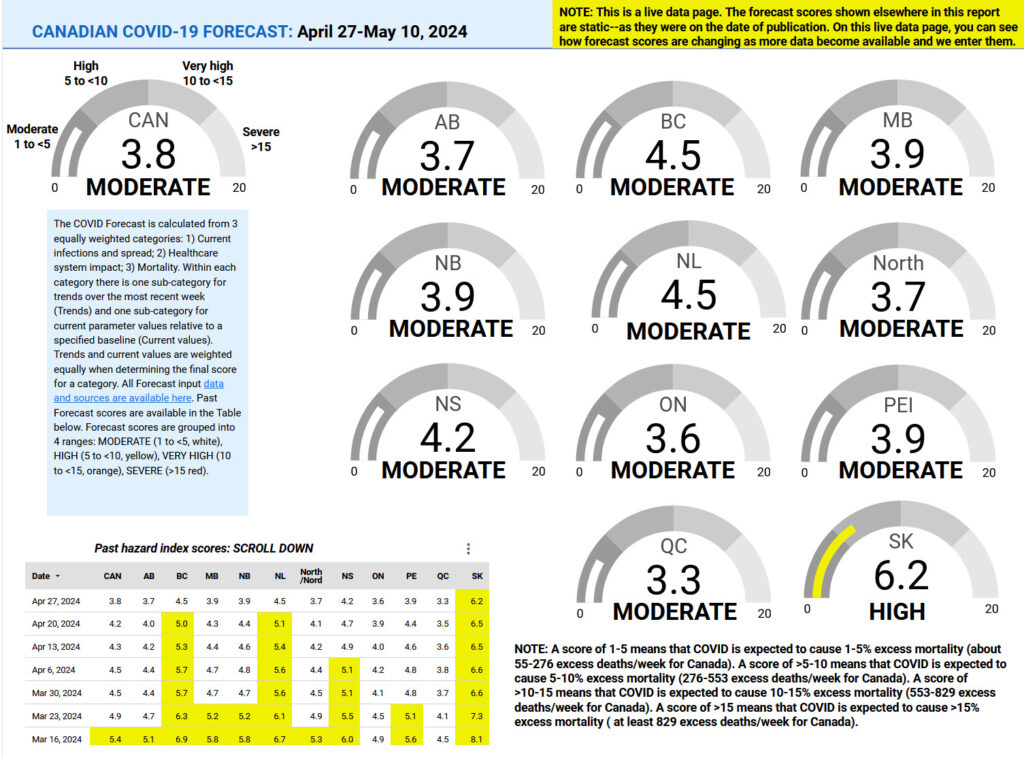
Most recent update, April 27, 2024, page updated May 02, 2024.
Note that while this is an “Out of 10” kind of chart, they’ve updated it to reflect expected excess mortality due to the pandemic over the forecast period. A safe level of Covid-19 infections is between 0 and 1. We haven’t dropped below 1 since early 2020.
This is a wonderful resource maintained by @MoriartyLab on X/Twitter, with the site located here:
Covid-19 (SARS-CoV2-2019) Information Site
More promising update – but don’t look at this as good – “safe” is between 0 and 1. anything over 3 is very bad, so we’re still very bad, just not completely out of control.

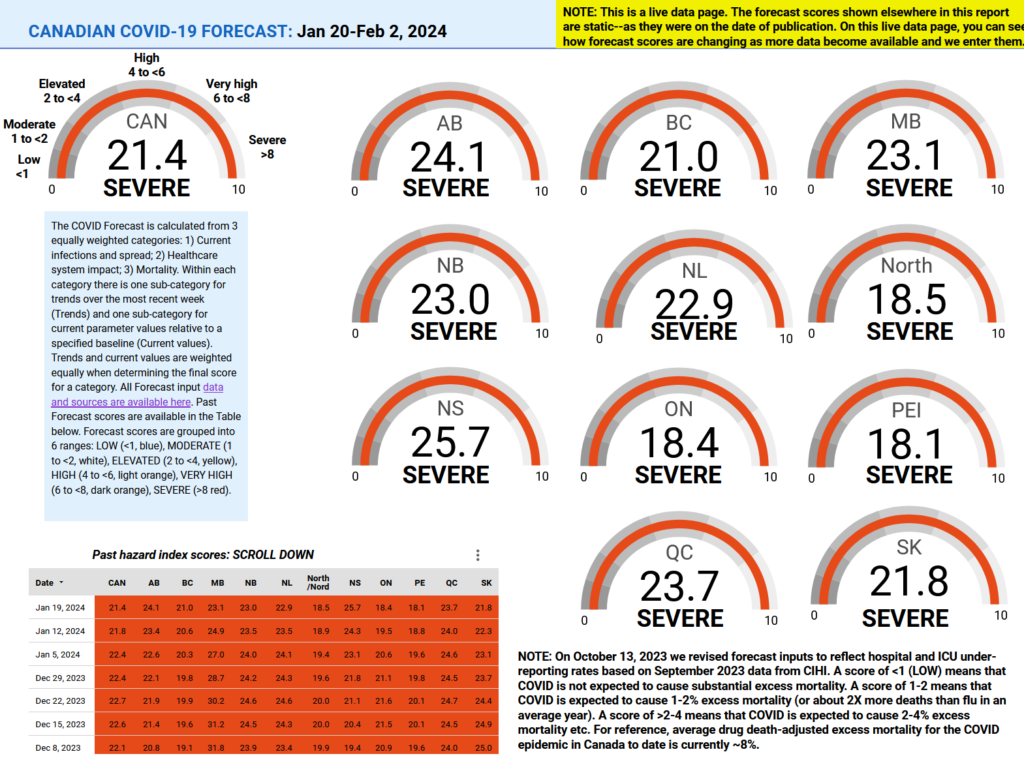
for context, the last update from January to February – improvement is good, but it’s not enough improvement to relax. We’re a very long way from the 0-1 “safe” level, even if we’re going from 20s to single digits. We’re not out of the woods, but we’re certainly in a better place than we were a few months ago.

